
 Facebook
 Twitter
 Pinterest
 Copy Link
Year-to-date Sales Statistics for the Niagara Region: from Jan. 1, 2021 to July 31, 2021 vs. the same period last year*
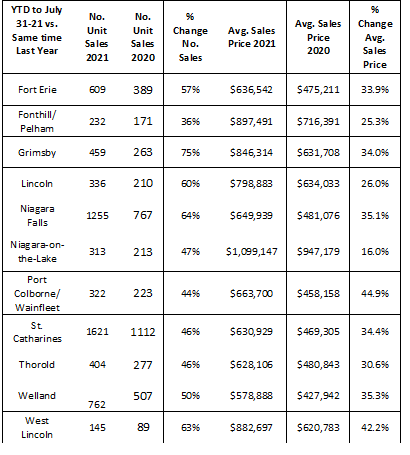
Overall in the Region:
July listings are up 8% from June; Number of Sales are down by approximately -16%
Average Prices Are Up dramatically vs. same time last year.
Number of Unit Sales are Up considerably in all areas and in double digit territory; from 44% Port Colborne to 75% Grimsby.
*The above stats are based in whole or in part on MLS® System data owned by the Association covering January 1, 2021 to July 31, 2021 YTD vs. January 1, 2020 to July 31, 2020 YTD.

